Observability: Nodejs Grafana and Statsd for Performance Monitoring
08.13.2021
Intro
Monitoring performance and uptime is a common task in server development. We often want to know how fast our endpoints are performing and if they are responding at all. With the help of statsd and Grafana, we can easily add metrics to our server. In this article we will learn how to use Grafana and Statsd to monitor performance in Node Js.
Installing Modules
Let's start by installing two modules. We will use express as our server, but you can use others, and statsd-client to help us connect to statsd.
npm install express statsd-clientStarting the Grafana and Statsd Server
Next, we will create a docker compose file touch docker-compose.yml to
help us launch Grafana and statsd. You can use the file below. Once you have the
file, run docker-compose up to start the servers.
version: '2.1'

services:
  statsd:
      image: graphiteapp/graphite-statsd
      container_name: statsd
      ports:
        - "8080:80"
        - "8125:8125/udp"

  grafana:
      image: grafana/grafana
      container_name: grafana
      ports:
        - "3000:3000"
Creating the Server
We start by creating a file and importing the two libraries above.
touch index.jsconst express = require('express')
const SDC = require('statsd-client')Then, we create a new statsd client.
const statsClient = new SDC({
host: 'localhost',
port: 3000
})Now, let's create a simple endpoint using express.
async function start() {
const app = express()
const port = 3001
app.get('/', (req, res) => {
const begin = new Date();
statsClient.timing('helloserver.hello-world.request-time', begin);
statsClient.increment('helloserver.hello-world.request-count');
res.send({
msg: 'Hello World!'
})
})
app.listen(port, () => {
console.log(`Example app listening at http://localhost:${port}`)
})
}Let's point out the two metrics here. We are using the following code. The first line will track the request time and the second is the request count.
Notice, that we name our metrics like so helloserver.hello-world.request-time. Each .
will namespace the values, which we will see later on.
There are a few other features you can use, so be sure to check out the statsd client library.
statsClient.timing('helloserver.hello-world.request-time', begin);
statsClient.increment('helloserver.hello-world.request-count');Finally, let's start the server.
(async () => {
await start()
})()Here is the full file for your reference.
const express = require('express')

const SDC = require('statsd-client')
const statsClient = new SDC({
    host: 'localhost',
    port: 3000
})
async function start() {
const app = express()
const port = 3001
app.get('/', (req, res) => {
const begin = new Date();
statsClient.timing('helloserver.hello-world.request-time', begin);
statsClient.increment('helloserver.hello-world..request-count');
res.send({
msg: 'Hello World!'
})
})
app.listen(port, () => {
console.log(`Example app listening at http://localhost:${port}`)
})
}
(async () => {
    await start()
})()node index.jsGrafana Dashboard
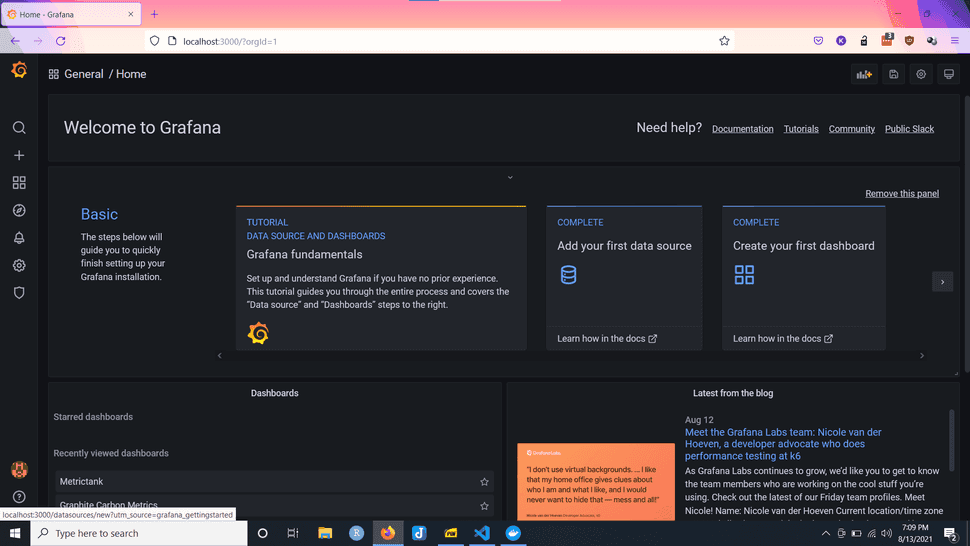
Now that we have some metrics, let's view them in the Grafana dashboard.
Start by going to http://localhost:3000/.
Now, login with admin/admin as the credential.
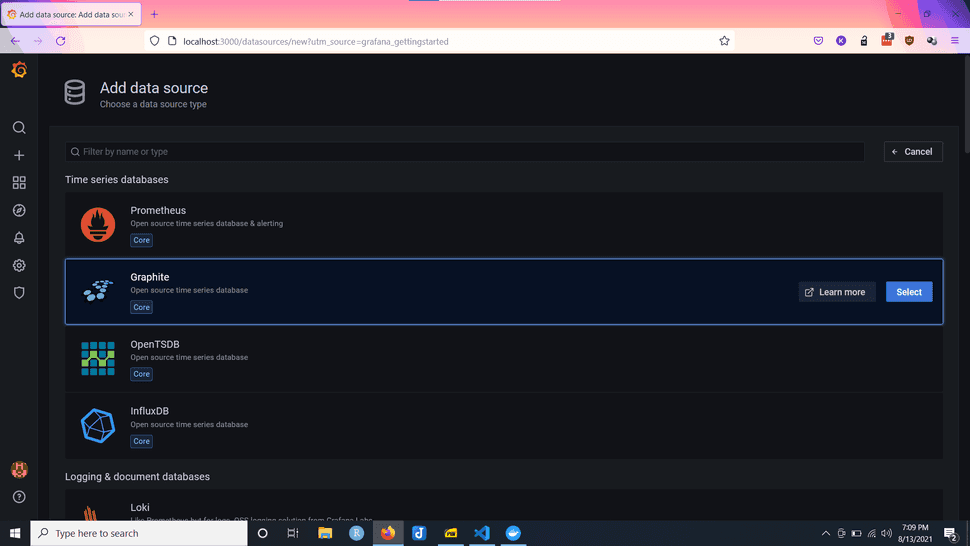
Next, we want to add a source.
Then, we will select graphite.
You will need to enter the url for our statsd http endpoint.
If you used the docker compose file above, you will enter http://{ip}:8080.
The IP address can't be localhost, so you will need to grab it from your network using one of the following methods.
- Linux:
hostname -I - Mac:
ipconfig getifaddr - Windows: https://www.howtogeek.com/723838/how-to-find-your-ip-address-on-a-windows-10-pc/
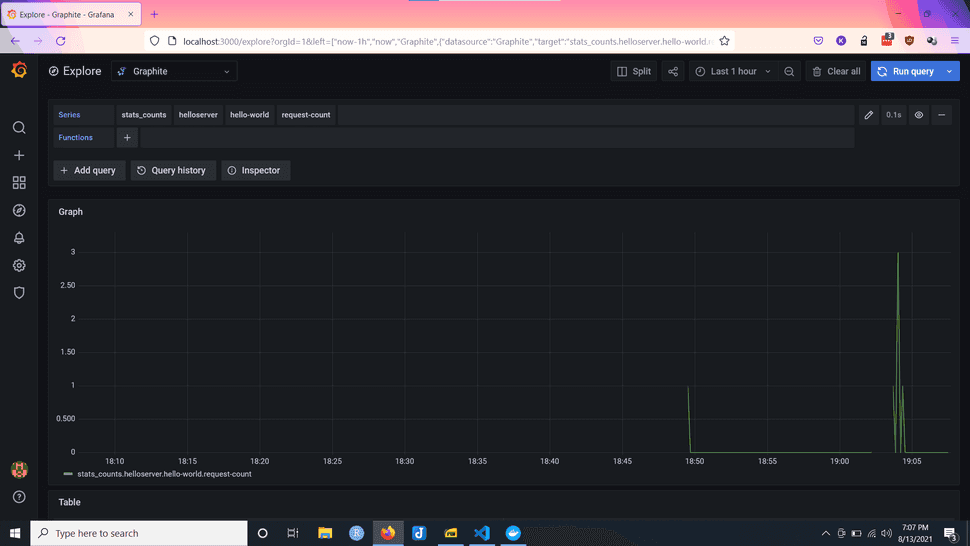
Now, let's visit http://localhost:3000/explore. Then, you can use the following two examples to get started with your queries.
Response Timing


