
Box Cox in Python
06.30.2021
Intro
A Box-Cox transformation is a preprocessing technique used to transform a distribution into a normally distributed one. Normal distribution is often a requirement, especially for linear regression. The Box-Cox transformation doesn't guarantee that your data will be normally distributed afterwards, so you will always need to check. In this article, we will learn how to conduct a box-cox transformation in python.
Example Box Cox in R
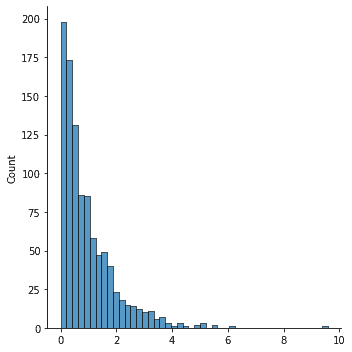
We begin by creating some mock data. We will generate samples from the exponential distribution. Notice from the histogram that our data is not normal.
import numpy as np
from scipy.stats import boxcox
import seaborn as sns

data = np.random.exponential(size=1000)

sns.displot(data)
<seaborn.axisgrid.FacetGrid at 0x27052effbe0>
The scipy.stats package provides a function called boxvox that will automatically transform the data for you. We pass our X vector in and the transformed data is returned.
transformed_data, best_lambda = boxcox(data)

sns.displot(transformed_data)
<seaborn.axisgrid.FacetGrid at 0x27052effb80>
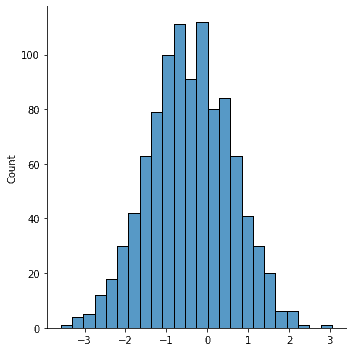
Notice that our data is more normal, but not completely normal. This is why you need to confirm with a graph. After this visual check, it would be good to run other normality tests, like shahpiro-wilk, to give further evidence of normality.