Observability: Python Distributed Tracing with Open Zipkin Example
08.19.2021
Intro
Eventually apps get complicated and make many requests. When building out services such as microservices or even just multi services, debugging our apps get a bit harder. The services will usually make requests to each other, especially when we need syncronous calls, async can be handled by message queues. In these situations, we can turn to Distributed Tracing to assist. In this article, we will learn Python distributed tracing with Open Zipkin.
Starting Zipkin
To start zipkin, we will use docker. We can start the server by running the following command.
docker run -d -p 9411:9411 openzipkin/zipkinInstalling modules
We will need quite a few modules for this project. Run the command below to install all the below.
pip install requests py_zipkin flask_zipkinCreating the Services
For this example, we will create two services. They will pretty much be the same except in name. The first service will also call the second service so that we can view the full trace.
Service 1
Start by including all the modules we installed.
touch index.pyfrom flask import Flask
import requests
from flask_zipkin import ZipkinNext, we will create our Flask app and attach Zipkin.
app = Flask(__name__)
zipkin = Zipkin(app, sample_rate=100)
app.config['ZIPKIN_DSN'] = "http://localhost:9411/api/v1/spans"Finally, we create an endpoint to call our next service.
@app.route('/')
def hello():
headers = {}
headers.update(zipkin.create_http_headers_for_new_span())
print(headers)
r = requests.get('http://localhost:5001', headers=headers)
return r.text
if __name__ == "__main__":
app.run()Here is the full code.
from flask import Flask
import requests
from flask_zipkin import Zipkin
app = Flask(__name__)

zipkin = Zipkin(app, sample_rate=100)
app.config['ZIPKIN_DSN'] = "http://localhost:9411/api/v1/spans"
@app.route('/')
def hello():
    headers = {}
    headers.update(zipkin.create_http_headers_for_new_span())
    print(headers)
    r = requests.get('http://localhost:5001', headers=headers)
    return r.text

if __name__ == "__main__":
app.run()Service 2
The second servce will be mostly the same, but will not have the fetch module calling anything, although you can add that for more tracing.
touch server2.pyfrom flask import Flask
import requests
from flask_zipkin import Zipkin
app = Flask(__name__)
zipkin = Zipkin(app, sample_rate=10)
app.config['ZIPKIN_DSN'] = "http://localhost:9411/api/v1/spans"
@app.route('/')
def hello():
return "Hello from server 2"
if __name__ == "__main__":
app.run(port=5001)Starting the services
Now, let's start both services. You will need to run them in two separate terminals.
python index.pyIn another terminal.
python server2.pyNow visit the first service in a browser or curl it.
curl http://localhost:5000/server1The Zipkin Dashboard
Now that we have some trace data, let's load up the Zipkin dashboard to view it. Start by visiting this url.
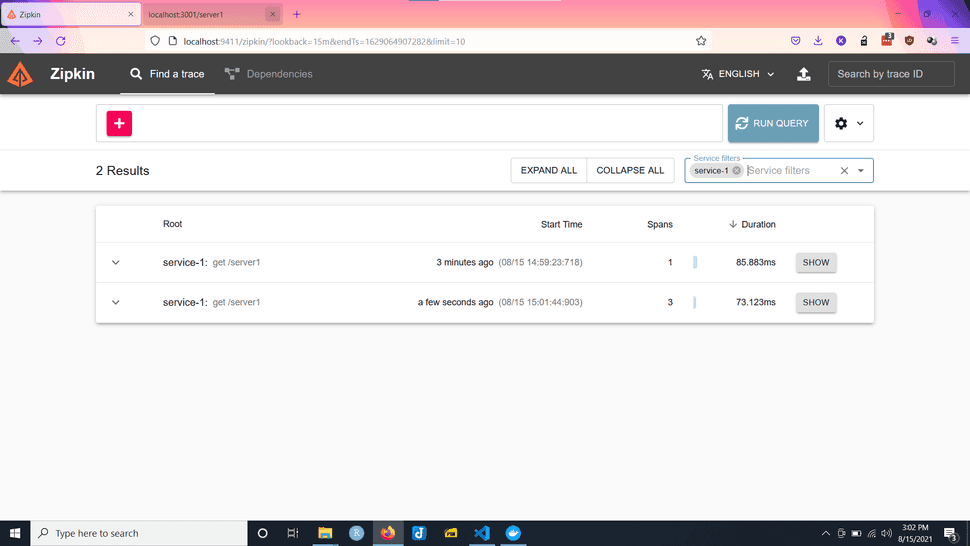
Click run query and you should see something similar to the below. Click one of the traces "Show" button.
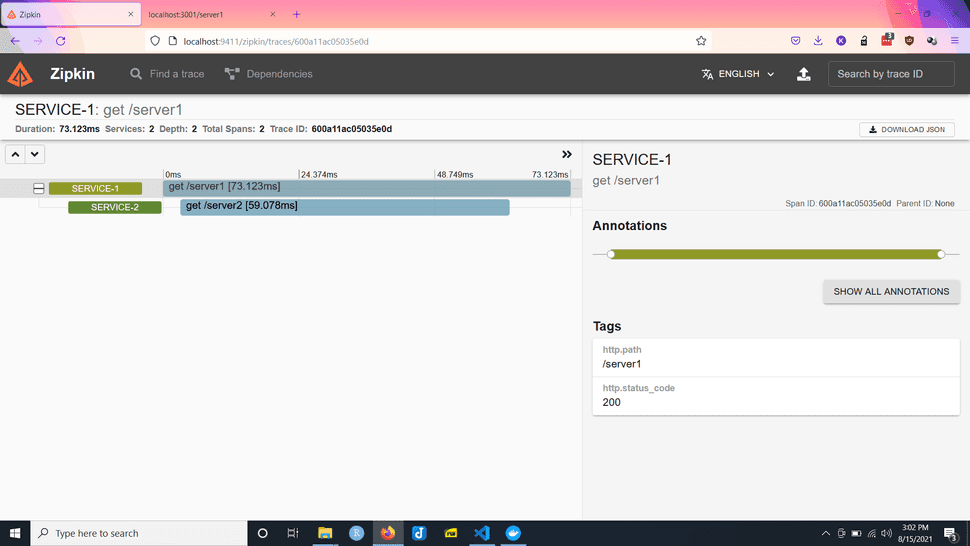
Here on the trace, we can see a timeline of the api calls.

