Python White Noise Simuation
08.06.2021
Intro
White noise is a base line model that appears when we have removed correlations and difference. The model is a simple list of random errors and serves as a base for many time series models. In this article, we will learn how to simulate white noise in R.
What is White Noise
White noise is defined that for each observation, we can compute this observation as random noise, usually from the normal distribution. The equation is as follows:
Where is distributed from normal distribution of mean 0 and 1.
Simulating by Hand
To get a very good understanding, let's try to simulate this by hand. We do this by sample each element from the random normal distribution, for example, say we ran rnorm(1, mean = 0, sd = 1) and received 1.5. That will be our first value.
Then, for our second value, we run the function again and get .4, that will be our second value. We can continue this way for as long as we like.
And now we have a small time series . We can continue this for as long as we want to simulate. Let's continue that way in code.
Simulating White Noise in R
First we will set a seed so that you can reproduce the same results, and we will create a size variable to designate how large of a time series we want to simulate.
import numpy as np

np.random.seed(1)

size = 200
Next, we will create an empty vector to hold all the data and initialize the first time series entry from a normal distribution.
x = []

# Create the first value
x.append(np.random.normal(0, 1, 1))
x[array([1.62434536])]Now, we loop until we have enough variables using the same computation we did above to create a variable at each step.
for t in range(1, size):
    # Create random noise for this observation
    w_error = np.random.normal(0, 1, 1)

    # Compute the current value based on the previous value and the current noise
    x_t = w_error
    x.append(x_t)
x[1:5]
[array([-0.61175641]),
array([-0.52817175]),
array([-1.07296862]),
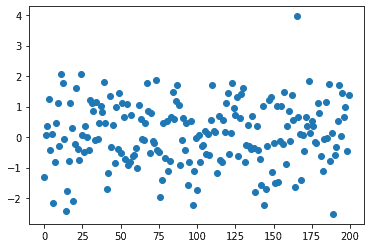
array([0.86540763])]Now, we can plot this data, and we will see a familiar white noise shape.
import matplotlib.pyplot as plt

plt.scatter(x = range(0, size), y = x)
<matplotlib.collections.PathCollection at 0x16f7a427790>

Simulating with a Library
In practice, we often want simulate a random walk by hand or incrementally in code. Instead, we can extend our use of numpy to create white noise. Below is an example of that.
We can do this with the np.random.normal function which will generate a bunch of random samples from the normal distribution.
white_noise = np.random.normal(loc = 0, scale = 1, size = size)We can end by plotting to see the white noise shape as expected.
import matplotlib.pyplot as plt

plt.scatter(x = range(0, size), y = white_noise)
<matplotlib.collections.PathCollection at 0x16f7a670d60>