How to Create a Scatter Plot with ggplot2 in R
05.20.2021
Intro
Scatter plots allow us to view relationships between two continuous variables. For example, we may want to check if their is a linear relationship between someone’s height and how much they weight. In this article, we will learn how to create a scatter plot with ggplot2 in R.
If You Are in a Hurry
library(ggplot2)
library(tidyverse)
## -- Attaching packages --------------------------------------- tidyverse 1.3.1 --
## v tibble 3.1.0 v dplyr 1.0.5
## v tidyr 1.1.3 v stringr 1.4.0
## v readr 1.4.0 v forcats 0.5.1
## v purrr 0.3.4
## -- Conflicts ------------------------------------------ tidyverse_conflicts() --
## x dplyr::filter() masks stats::filter()
## x dplyr::lag() masks stats::lag()data(starwars, package = 'dplyr')
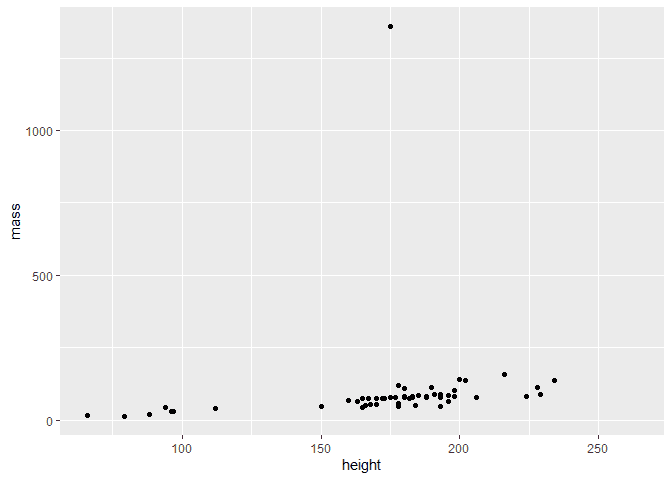
ggplot(starwars, aes(x=height, y=mass)) +
geom_point()
Loading the Data
library(tidyverse)
data(starwars, package = 'dplyr')

glimpse(starwars)
## Rows: 87
## Columns: 14
## $ name <chr> "Luke Skywalker", "C-3PO", "R2-D2", "Darth Vader", "Leia Or~
## $ height <int> 172, 167, 96, 202, 150, 178, 165, 97, 183, 182, 188, 180, 2~
## $ mass <dbl> 77.0, 75.0, 32.0, 136.0, 49.0, 120.0, 75.0, 32.0, 84.0, 77.~
## $ hair_color <chr> "blond", NA, NA, "none", "brown", "brown, grey", "brown", N~
## $ skin_color <chr> "fair", "gold", "white, blue", "white", "light", "light", "~
## $ eye_color <chr> "blue", "yellow", "red", "yellow", "brown", "blue", "blue",~
## $ birth_year <dbl> 19.0, 112.0, 33.0, 41.9, 19.0, 52.0, 47.0, NA, 24.0, 57.0, ~
## $ sex <chr> "male", "none", "none", "male", "female", "male", "female",~
## $ gender <chr> "masculine", "masculine", "masculine", "masculine", "femini~
## $ homeworld <chr> "Tatooine", "Tatooine", "Naboo", "Tatooine", "Alderaan", "T~
## $ species <chr> "Human", "Droid", "Droid", "Human", "Human", "Human", "Huma~
## $ films <list> <"The Empire Strikes Back", "Revenge of the Sith", "Return~
## $ vehicles <list> <"Snowspeeder", "Imperial Speeder Bike">, <>, <>, <>, "Imp~
## $ starships <list> <"X-wing", "Imperial shuttle">, <>, <>, "TIE Advanced x1",~# Filter out an outlier that has a large mass
starwars = starwars %>% filter(mass < 1000)The Basic Plot
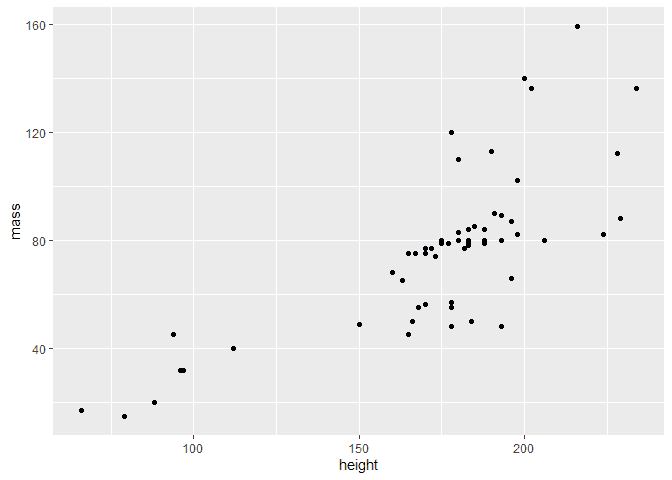
To create a scatter plot in ggplot2, we first create a plot object using
the ggplot method. It has the following signature.
ggplot(dataframe, aesthetic). We then add this ggplot to a
geom_point layer which will display a scatter plot.
library(ggplot2)

ggplot(starwars, aes(x=height, y=mass)) +
  geom_point()
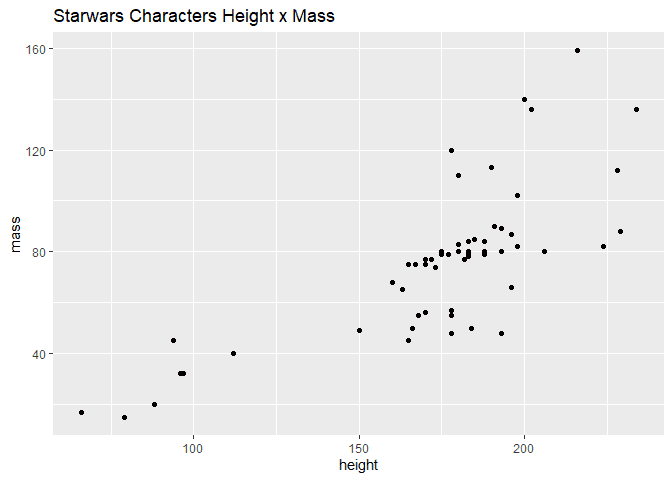
Adding a title
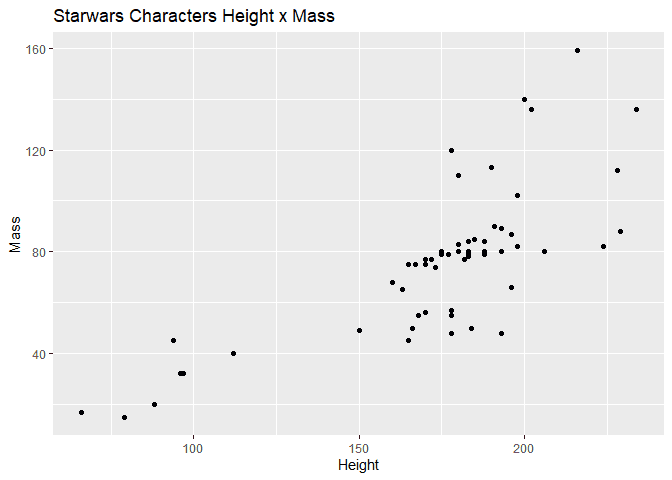
We can add a title to our plot using the labs label function. We
simplay pass a title paramter to this function and add it to our ggplot.
ggplot(starwars, aes(x=height, y=mass)) +
  geom_point() +
  labs(title = "Starwars Characters Height x Mass")
Adding labels
Similar to above, we can add labels to the x and y axis by using the
label function and passing x and y parameters.
ggplot(starwars, aes(x=height, y=mass)) +
  geom_point() +
  labs(title = "Starwars Characters Height x Mass",
       x = "Height",
       y = "Mass")
Customizing the Grid
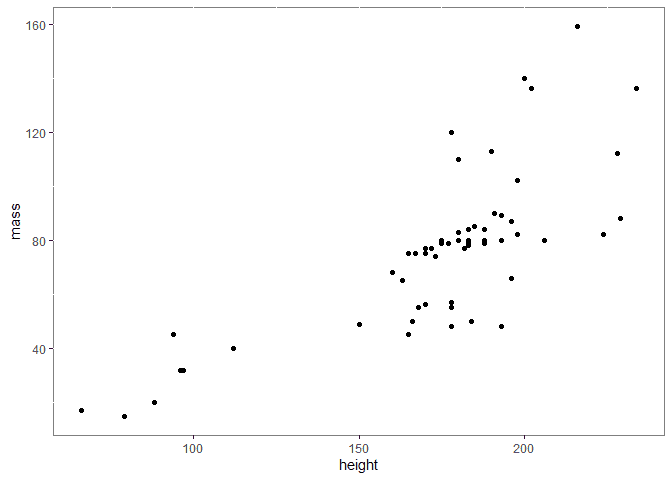
We can use the theme function to customize our grid. If we pass an
element_rect object to the panel.background parameter in the theme
method, we can change some settings of our background. That may seem a
bit convoluted, but the example below will make it clear. Below, we
start by changing the background to white and the border to grey.
Notice, that this essentially removes our grid.
ggplot(starwars, aes(x=height, y=mass)) +
  geom_point() +
  theme(panel.background = element_rect(fill = "white", color = "grey50"))
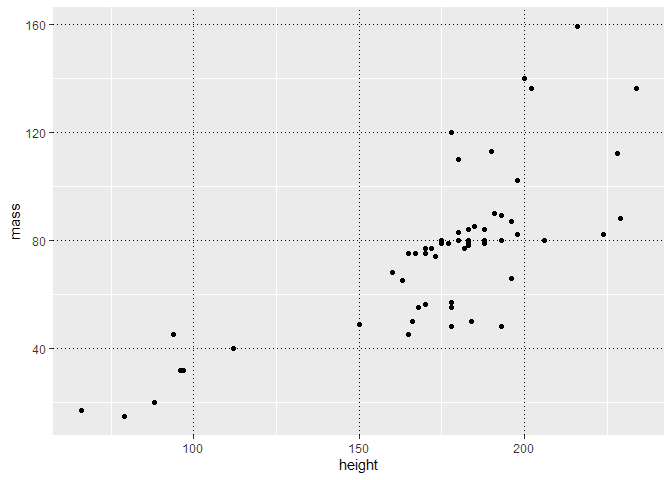
We can also alter the grid rather than remove it. Below we darken the
line colors and change the linetype to 3 which creates dashed lines.
Notice we also use the panel.grid.major parameter to customize the
grid itself rather than the background.
ggplot(starwars, aes(x=height, y=mass)) +
  geom_point() +
  theme(panel.grid.major = element_line(color = "black", linetype = 3))
Using Themes
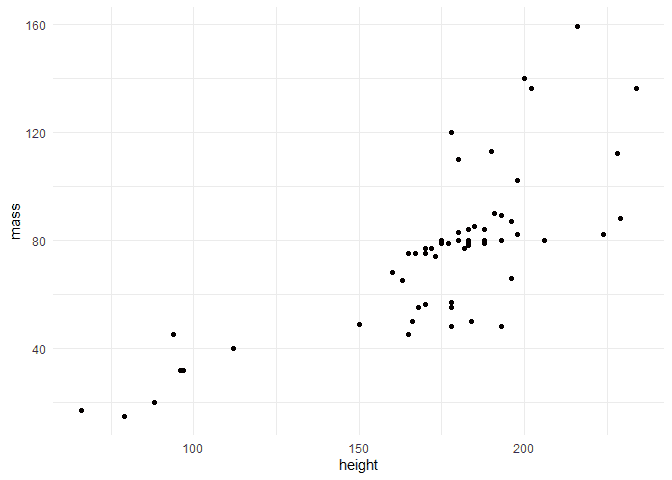
Instead of customizing the finer details ourselves, ggplot provides us
with many themese we can use. To add a theme, we simply add the method
prefixed with theme to our plot. Here is an example.
ggplot(starwars, aes(x=height, y=mass)) +
  geom_point() +
  theme_minimal()
A few of the support themes are listed below. - theme_bw() - theme_dark() - theme_classic() - theme_gray() - theme_linedraw() - theme_light() - theme_minimal() - theme_test() - theme_void()
Multiple Groups on a Scatter Plot
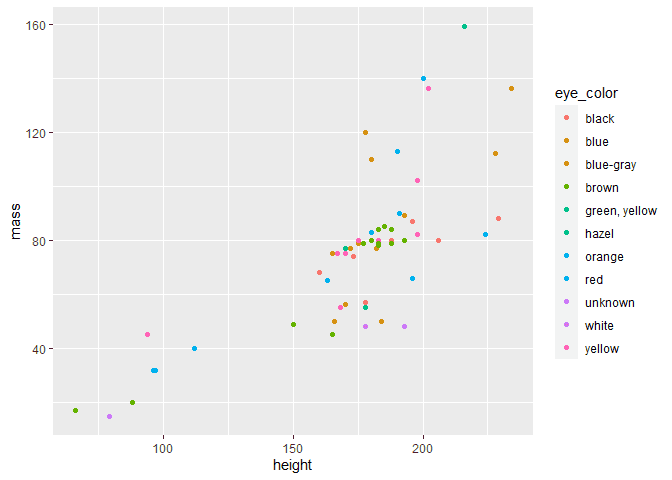
Similar to other ggplots, we can use parameters in the aes to separate
groups by a factor variable. For example, we can do the following to
separate our observations by eye_color using colour.
ggplot(starwars, aes(x=height, y=mass, colour=eye_color)) +
  geom_point()
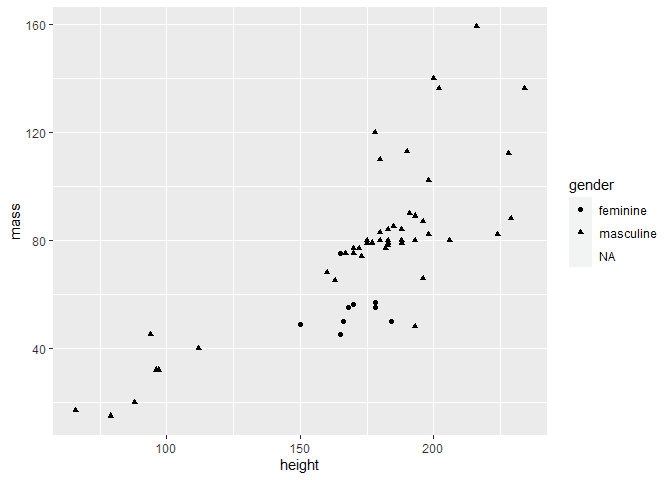
Similarly, we can do the same using shape.
ggplot(starwars, aes(x=height, y=mass, shape=gender)) +
  geom_point()
## Warning: Removed 1 rows containing missing values (geom_point).
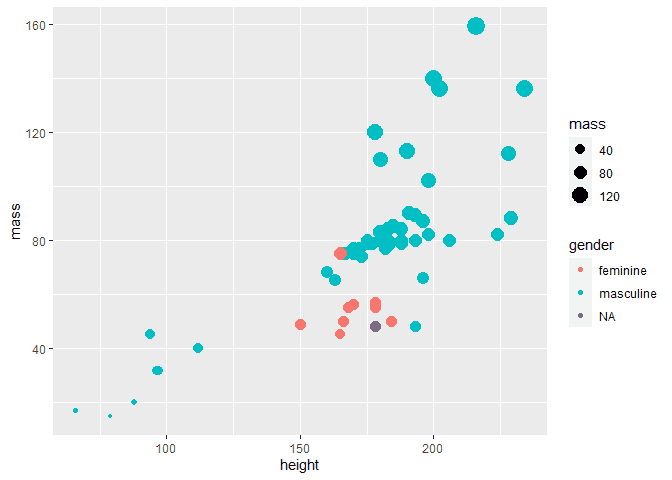
Creating Bubble Chart
Another way to represent a third dimenision is using size. This
effectly creates a bubble chart. Each of the points will have a varying
size based on the values in our observations.
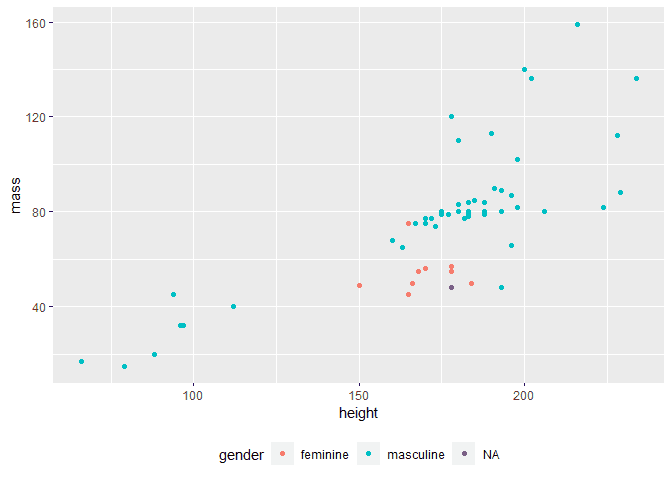
ggplot(starwars, aes(x=height, y=mass, colour=gender)) +
  geom_point(aes(size = mass))
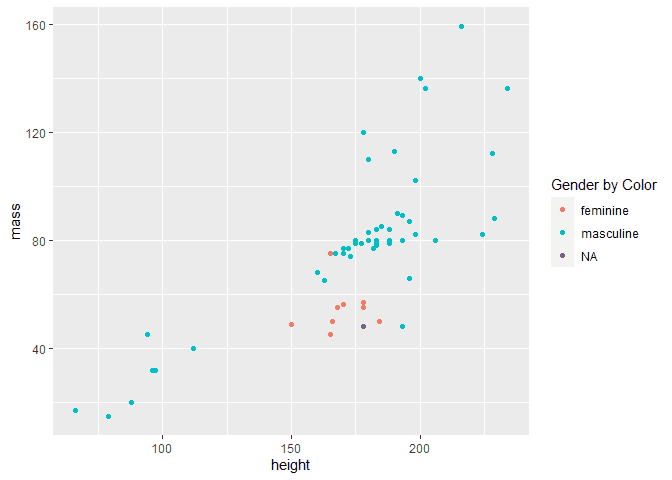
Adding a legend
When we add a separation by group using color, size, etc, we see that a
legend is automatically added by ggplot. We can customize this legend
using the guides and theme methods.
ggplot(starwars, aes(x=height, y=mass, colour=gender)) +
  geom_point() +
  guides(colour = guide_legend(title="Gender by Color"))
ggplot(starwars, aes(x=height, y=mass, colour=gender)) +
  geom_point() +
  theme(legend.position = "bottom")
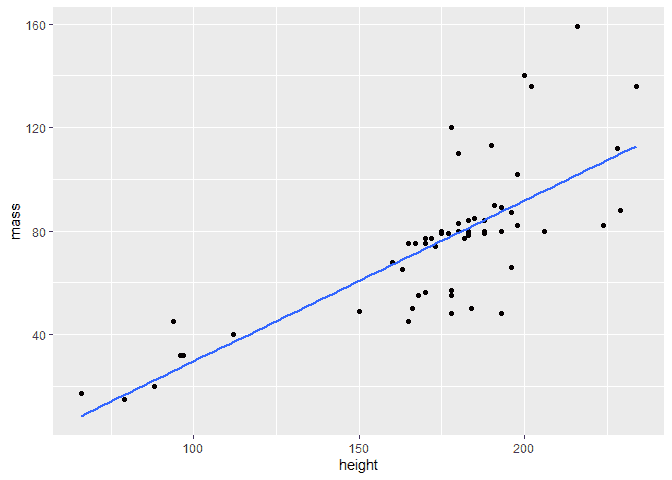
Adding a Regression Line
Often when plotting two continuous variables, you would like to plot a
linear model on top of the scatter plot. We can do this in ggplot
using the geom_smooth method. There are multiple parameters to use
when plotting a model. Below is an example of a simple linear model.
ggplot(starwars, aes(x=height, y=mass)) +
  geom_point() +
  geom_smooth(method = "lm",
              formula = y ~ x,
              se = FALSE)
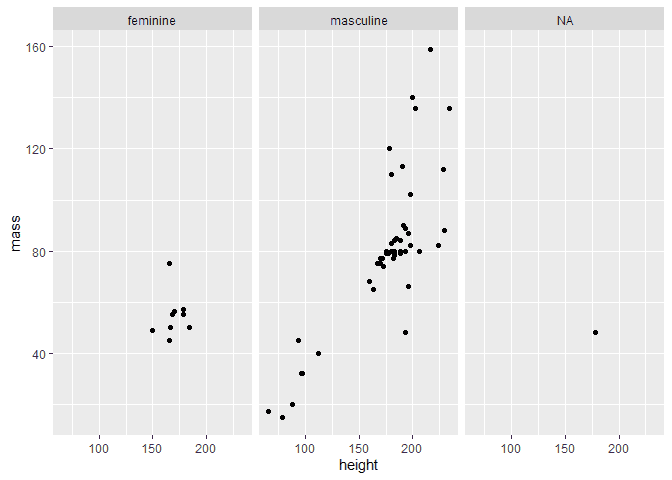
Using Facets to create Multiple Scatter Plots
We can also create separate plots for each of our groups using ggplot’s facets. For example, we wanted a separate plot for each gender, we can do the following.
ggplot(starwars, aes(x=height, y=mass)) +
  geom_point() +
  facet_wrap(~gender)