Pivot Table in R
06.22.2021
Intro
Pivot tables allow you to summarize groups of data easily. We can simply group data by different categorize and see summaries like totals, mean, etc. In this article, we will learn how to create pivot tables in R.
Data
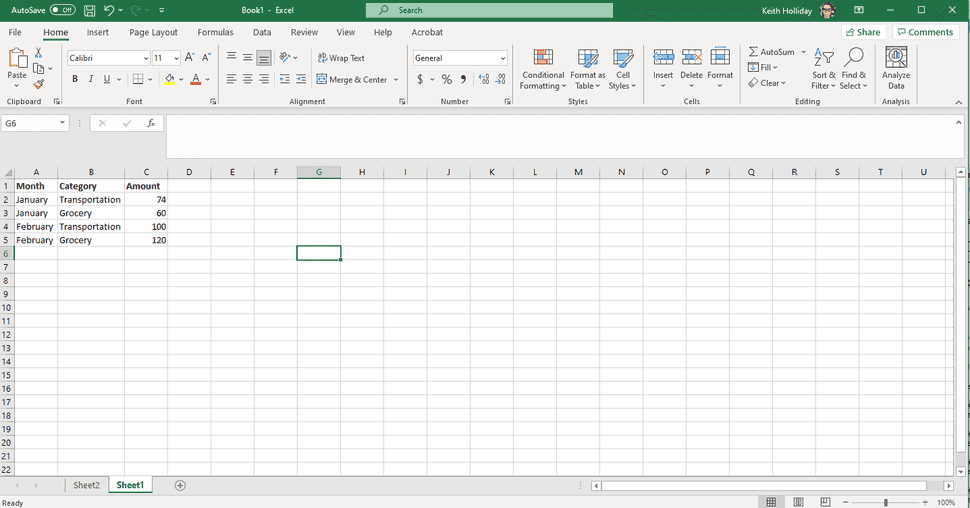
In Excel, I create pivot tables all the time. Here is an example of spending data. We have the month, category and amount. Here is the example screenshot.
We can recreate that data using the code below. Normally you would just import an Excel sheet.
data <- data.frame(
  month = c("January", "January", "February", "February"),
  category = c("Transport", "Grocery", "Transport", "Grocery"),
  amount = c(74, 60, 100, 120)
)
Creating the Pivot Table
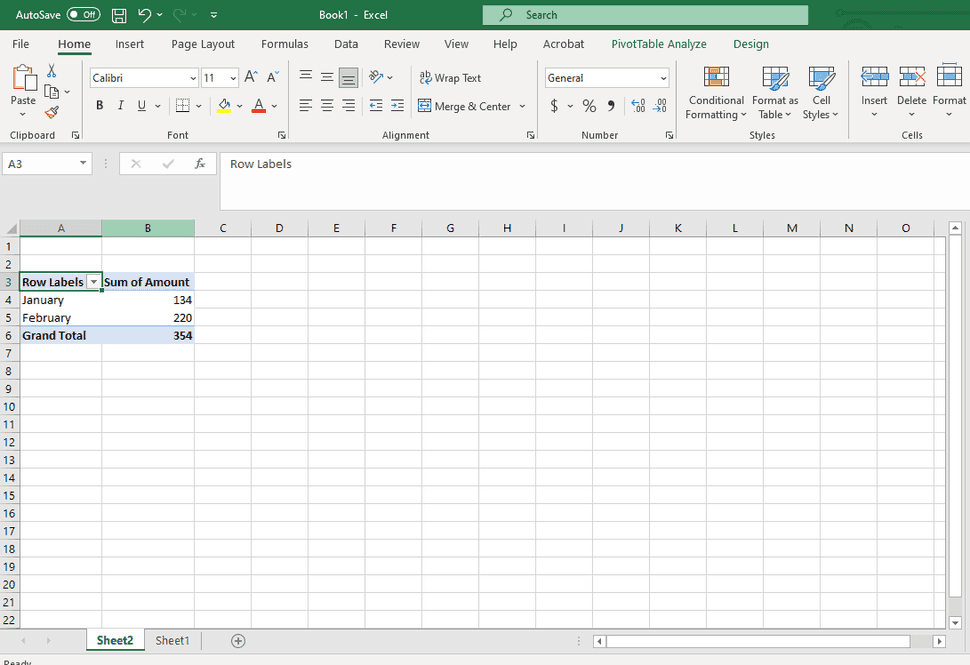
Now, let’s say we want to see the total per month. Here is an example of what it looks like in Excel.
We can create this using the dplyr package. We can use the group_by
method to group by month, then we can use the summarize function with
a new column called total which will sum the amount by month.
library(dplyr)##
## Attaching package: 'dplyr'
## The following objects are masked from 'package:stats':
##
## filter, lag
## The following objects are masked from 'package:base':
##
## intersect, setdiff, setequal, uniondata %>%
group_by(month) %>%
summarize(total = sum(amount))## # A tibble: 2 x 2
## month total
## <chr> <dbl>
## 1 February 220
## 2 January 134We can also create a new pivot table by category using the same code
above, but change the group to category instead.
library(dplyr)

data %>%
  group_by(category) %>%
  summarize(total = sum(amount))
## # A tibble: 2 x 2
## category total
## <chr> <dbl>
## 1 Grocery 180
## 2 Transport 174
