
How to plot time series in R
07.01.2021
Intro
When working with time series models, we would often like to plot the data to see how it changes over time. This is a simply line plot, but the x-axis is always dates. In this article, we will learn how to plot a time series in R.
Data
Let’s load a data set of monthly milk production. We will load it from the url below. The data consists of monthly intervals and kilograms of milk produced.
df <- read.csv('https://raw.githubusercontent.com/ourcodingclub/CC-time-series/master/monthly_milk.csv')
df$month = as.Date(df$month)
head(df)
## month milk_prod_per_cow_kg
## 1 1962-01-01 265.05
## 2 1962-02-01 252.45
## 3 1962-03-01 288.00
## 4 1962-04-01 295.20
## 5 1962-05-01 327.15
## 6 1962-06-01 313.65Using the Built in Time Series Plot
We will start by using the built in time series functions. We can use
the ts function to convert our data frame to a time series We first
pass the data frame, then the frequency of 12 since this is monthly
data, and finally we pass the start date.
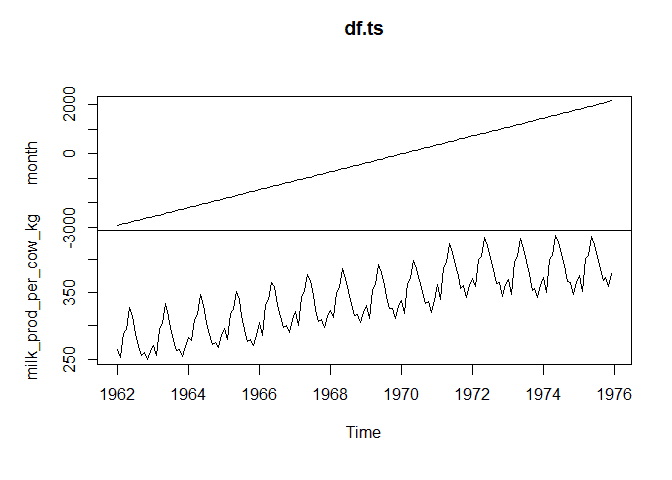
Now, we can pass this time series to the plot.ts function and R will
automatically plot this.
df.ts = ts(df, frequency = 12, start=c(1962, 1))
plot.ts(df.ts)
Plotting XTS Time Series
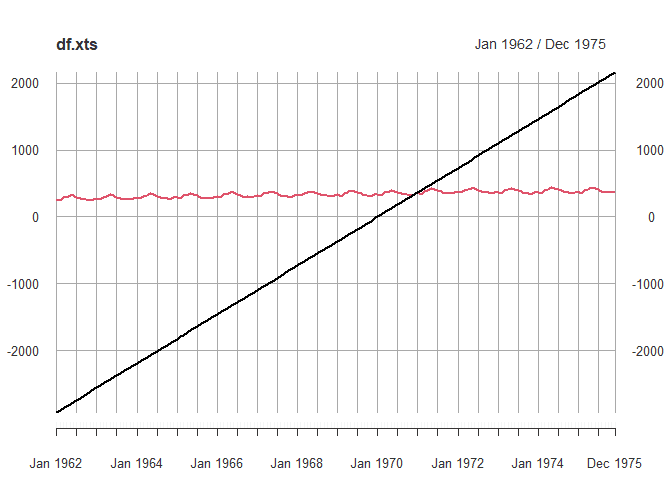
Next, we will plot a xts object. xts is a library that enhances the
built in time series. We will start by converting our time series to an
xts time series using as.xts. Then, we pass this to the built in
plot function. We can see a slightly more colorful plot then the
above.
library(xts)## Warning: package 'xts' was built under R version 4.0.5
## Loading required package: zoo
## Warning: package 'zoo' was built under R version 4.0.5
##
## Attaching package: 'zoo'
## The following objects are masked from 'package:base':
##
## as.Date, as.Date.numericdf.xts = as.xts(df.ts)
plot(df.xts)
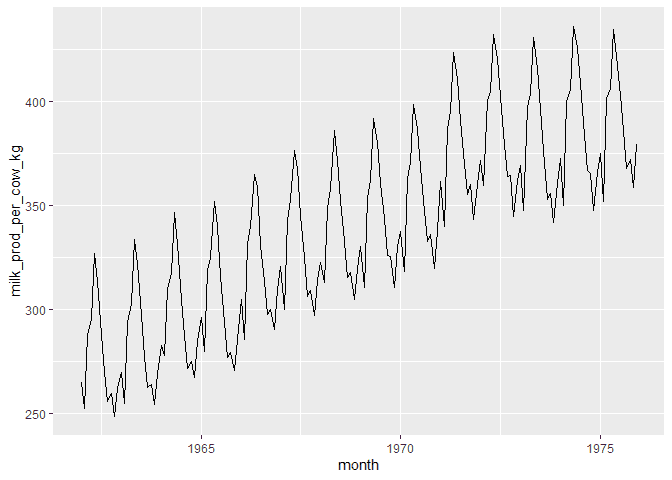
Plotting a Time Series with
For you tidyverse users, you may want to see how we can plot a time series using ggplot. To do this, we simply create a line plot with the data on the x-axis and the milk on the y axis.
library(ggplot2)

ggplot(df, aes(x = month, y = milk_prod_per_cow_kg)) +
       geom_line()
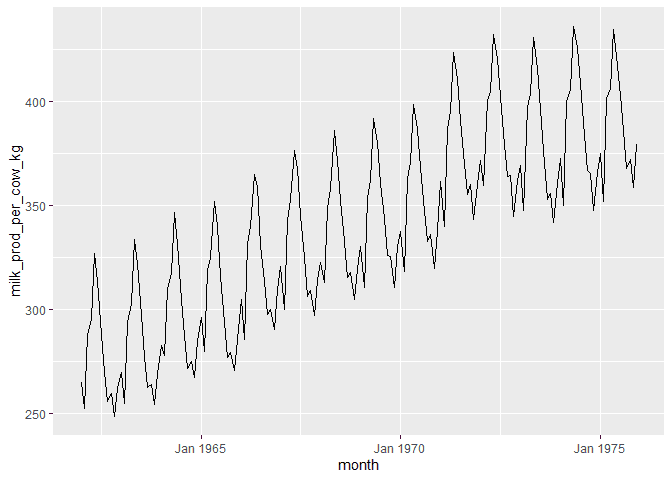
We can customize the labels of our dates using the scale_x_date and
the date_labels parameter.
ggplot(df, aes(x = month, y = milk_prod_per_cow_kg)) +
       geom_line() +
       scale_x_date(date_labels = "%b %Y")
We can also customize the breaks of the date labels using the
scale_x_date and the date_breaks named parameter.
ggplot(df, aes(x = month, y = milk_prod_per_cow_kg)) +
       geom_line() +
       scale_x_date(date_breaks = "2 year")
