Detrending Time Series in Python
07.22.2021
Intro
A common task in time series analysis is taking the difference or detrending of a series. This is often used to take a non-stationary time series and make it stationary. In this article, we will learn how to detrend a time series in Python.
Data
Let's load a data set of monthly milk production. We will load it from the url below. The data consists of monthly intervals and kilograms of milk produced.
import pandas as pd

df = pd.read_csv('https://raw.githubusercontent.com/ourcodingclub/CC-time-series/master/monthly_milk.csv')

df.month = pd.to_datetime(df.month)
df = df.set_index('month')
df.head()| milk_prod_per_cow_kg | |
|---|---|
| month | |
| 1962-01-01 | 265.05 |
| 1962-02-01 | 252.45 |
| 1962-03-01 | 288.00 |
| 1962-04-01 | 295.20 |
| 1962-05-01 | 327.15 |
Detrending
Let's first plot our time series to see the trend.
df.plot()<AxesSubplot:xlabel='month'>
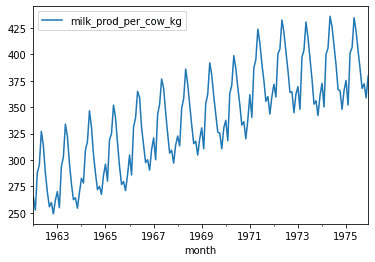
There seems to be a a linear trend. Let's see what happens after detrending. To do detrending, we can use the detrend function from the scipy module.
from scipy import signal

detrended = signal.detrend(df.milk_prod_per_cow_kg)

detrended_df = pd.DataFrame(detrended)
detrended_df.plot()
<AxesSubplot:>
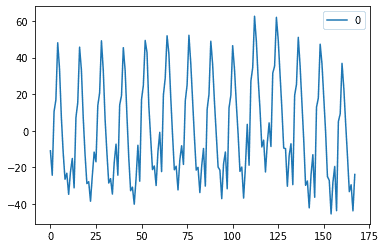
That is looking really good. The Linear trend seems to be gone.
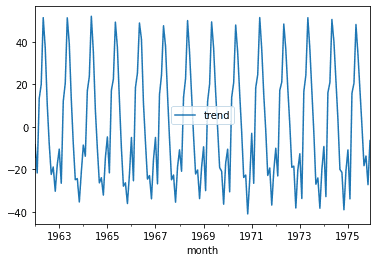
Removing a Seasonal Trend
After removing a linear trend, we also want to remove seasonality so that we can model the data. To do this we can use the seasonal_decompose function from the statsmodels package.
from statsmodels.tsa.seasonal import seasonal_decomposeres = seasonal_decompose(df.milk_prod_per_cow_kg, model='multiplicative', extrapolate_trend='freq')
detrended = df.milk_prod_per_cow_kg.values - res.trend
detrended_df = pd.DataFrame(detrended)
detrended_df.plot()<AxesSubplot:xlabel='month'>