Detrending Time Series in R
07.21.2021
Intro
A common task in time series analysis is taking the difference or detrending of a series. This is often used to take a non-stationary time series and make it stationary. In this article, we will learn how to detrend a time series in R.
Data
Let’s load a data set of monthly milk production. We will load it from the url below. The data consists of monthly intervals and kilograms of milk produced.
df <- read.csv('https://raw.githubusercontent.com/ourcodingclub/CC-time-series/master/monthly_milk.csv')
df$month = as.Date(df$month)
head(df)
## month milk_prod_per_cow_kg
## 1 1962-01-01 265.05
## 2 1962-02-01 252.45
## 3 1962-03-01 288.00
## 4 1962-04-01 295.20
## 5 1962-05-01 327.15
## 6 1962-06-01 313.65Now, we convert our data to a time series object then to an zoo object
to have access to many indexing methods explored below.
library(zoo)##
## Attaching package: 'zoo'
## The following objects are masked from 'package:base':
##
## as.Date, as.Date.numericdf.ts = ts(df[, -1], frequency = 12, start=c(1962, 1, 1))
df.ts = as.zoo(df.ts)
head(df.ts)## Jan 1962 Feb 1962 Mar 1962 Apr 1962 May 1962 Jun 1962
## 265.05 252.45 288.00 295.20 327.15 313.65Detrending
Let’s first plot our time series to see the trend.
plot(df.ts)
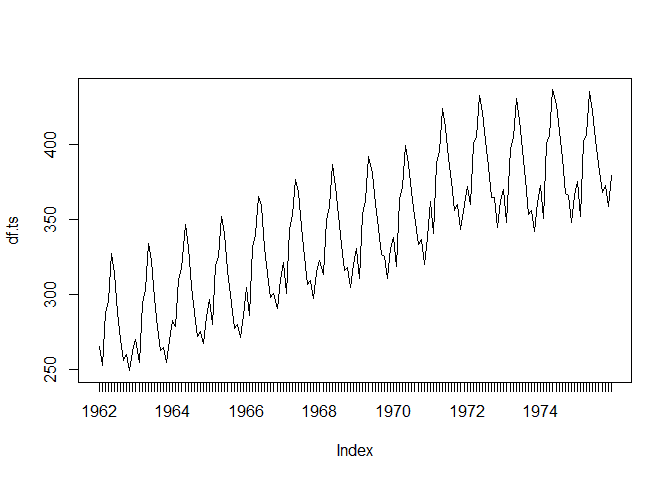
There seems to be a a linear trend. Let’s see what happens after
detrending. To do detrending, we can use the diff function.
diff.ts = diff(df.ts)
plot(diff.ts)
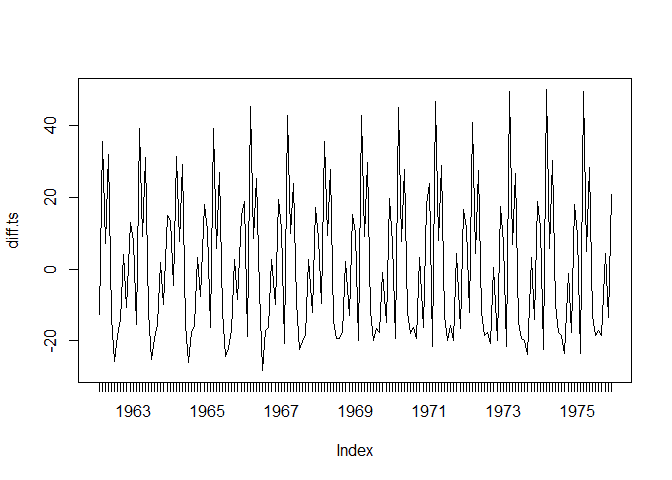
That is looking really good. The Linear trend seems to be gone.
Multiple Differencing
Sometimes, we want to take a different multiple times. This is often the
case when modeling. We can do this in multiple ways. The first way is we
can simply call the diff function multiple times.
diff.ts = diff(df.ts)
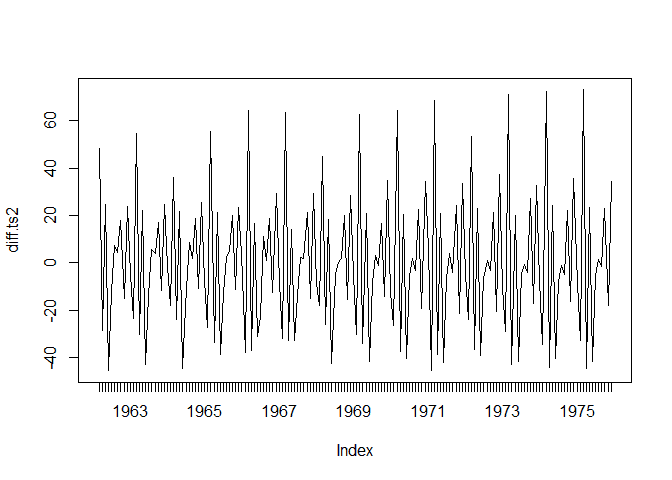
diff.ts2 = diff(diff.ts)
plot(diff.ts2)

However, we can also use the differences named parameter on the diff
function to get the same result.
diff.ts2 = diff(df.ts, differences = 2)
plot(diff.ts2)