
How to Check Stationarity of Time Series Data in Python
08.01.2021
Intro
Before modeling a time series data set, we often want to check if the data is stationary. Many models assume stationary time series, and if this assumption is violated, our forcast will not be reliable. In this article, we will learn how to check stationarity of time series data in Python.
Data
Let's load a data set of monthly milk production. We will load it from the url below. The data consists of monthly intervals and kilograms of milk produced.
import pandas as pd

df = pd.read_csv('https://raw.githubusercontent.com/ourcodingclub/CC-time-series/master/monthly_milk.csv')

df.month = pd.to_datetime(df.month)
df = df.set_index('month')
df.head()| milk_prod_per_cow_kg | |
|---|---|
| month | |
| 1962-01-01 | 265.05 |
| 1962-02-01 | 252.45 |
| 1962-03-01 | 288.00 |
| 1962-04-01 | 295.20 |
| 1962-05-01 | 327.15 |
Visually Checking
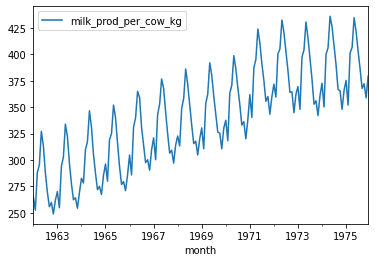
One way to check if the data is stationary is to plot the data. This should always be used in combination with other methods, but some data easily show trends and seasonility. For example the plot below, we can see that there is a trend upward and a definitely seasonal pattern.
df.plot()<AxesSubplot:xlabel='month'>
Using the ADF Test
Another way to check if the data is stationary is to use the ADF test. This test will check for a unit root. If there is a unit root, then the data is not stationary. The ADF test is a hypothesis test with the null hypothesis being there is a unit root (non-stationary) and the alternative being there is not a unit root (stationary). We can use the adfuller method from the statsmodels library to check.
from statsmodels.tsa.stattools import adfuller

adfuller(df)
(-1.3038115874221432,
0.6274267086030254,
13,
154,
{'1%': -3.473542528196209,
'5%': -2.880497674144038,
'10%': -2.576878053634677},
870.8296896968735)# Get the p-value
res = adfuller(df)
res[1]0.6274267086030254Using the Ljung-Box test
Another test we can use is the Ljung-Box test. This test will check our data for independence. This is another hypothesis test with the assumption being that the data is independent, thus stationary. Alternatively, if we get a low p-value, we can reject the null hypothesis and assume the data is non-stationary.
from statsmodels.stats.diagnostic import acorr_ljungbox

acorr_ljungbox(df, lags=[1], return_df=True)| lb_stat | lb_pvalue | |
|---|---|---|
| 1 | 135.942829 | 2.053590e-31 |