How to Conduct a Shapiro Test in R
05.24.2021
Intro
When building different models like regression and conduct statistical tests such as ANOVA, t-tests, etc, it is often required that the data be normally distributed. To check for this, you can verify visually and by using a number of tests. The Shapiro-Wilk test is one of those normality tests that is very popular and widely used. In this article, we will learn how to test normality with the Shapiro-Wilk test in R.
The Shapiro Wilk Test
R provides a method called shapiro.test that takes in a vector, which
is usually your sample, and conducts the shaprio wilk test on that
sample. The function will also provide the W statistic from the shaprio
wilk test and a p-value. The default test is based on an alpha of .05.
One other thing to note, is that your sample size must be between 3-5000
to use the test.
Using the Shaprio-Wilk Test
Let’s see how the shaipro.test works in action. We will start with an
example on data that follows the normal distribution. Do this, we can
use the rnorm function to generate a sample of random normal numbers.
sample = rnorm(1000)

shapiro.test(sample)
##
## Shapiro-Wilk normality test
##
## data: sample
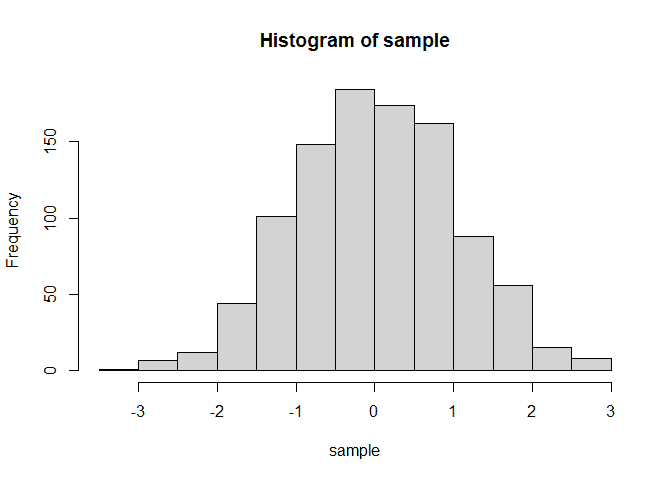
## W = 0.99899, p-value = 0.867You can also check this visually using a histogram.
hist(sample)

Non-Normal Data
Now that we see how the shaipro.test works on normally distributed
data, let’s see the opposite. We can generate a sample for the
chi-squared distribution and conduct the same test.
sample = rnorm(1000)

shapiro.test(sample)
##
## Shapiro-Wilk normality test
##
## data: sample
## W = 0.99847, p-value = 0.534You can also check this visually using a histogram.
hist(sample)