
How to Conduct a Normality Test in R
05.23.2021
Intro
Many tests in statics and other tasks rely on the assumption that your data is somewhat normally distributed. For example, when modeling with linear regression, normality is assumed. This is similar for many hypothesis tests. In this article, we will learn how to conduct Normality Tests in R.
Loading the Data
For this tutorial, we will use the mtcars data set that is built in to
R. We can load using the following command: data(mtcars).
data(mtcars)
head(mtcars)
## mpg cyl disp hp drat wt qsec vs am gear carb
## Mazda RX4 21.0 6 160 110 3.90 2.620 16.46 0 1 4 4
## Mazda RX4 Wag 21.0 6 160 110 3.90 2.875 17.02 0 1 4 4
## Datsun 710 22.8 4 108 93 3.85 2.320 18.61 1 1 4 1
## Hornet 4 Drive 21.4 6 258 110 3.08 3.215 19.44 1 0 3 1
## Hornet Sportabout 18.7 8 360 175 3.15 3.440 17.02 0 0 3 2
## Valiant 18.1 6 225 105 2.76 3.460 20.22 1 0 3 1Visual Normality Tests
There are two visual tests we can conduct to check normality. The first is to plot the distribution of our variables and see if the distribution matches the normal distribution. Let’s see an example with the horse power of our cars in the mtcars data set. We can see the horse power seems to be skewed right and does not follow the normal distribution.
hist(mtcars$hp)

The second way is to create a QQ plot. On a QQ plot we look to see if
the data follows a straight, positive, increasing line. We can use R’s
qqnorm and qqline to create this plot.
## Plot with a qqnorm and line
qqnorm(mtcars$hp)
qqline(mtcars$hp)
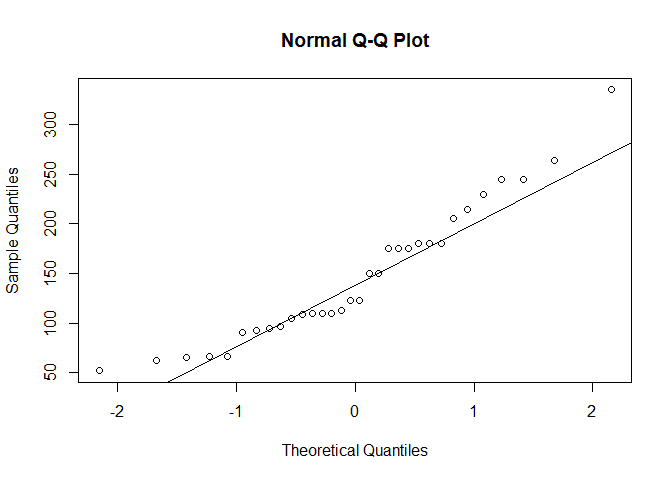
Above we can see that the poitns deviate from the straight line and don’t seem to follow a normal distribution.
Hypothesis Tests
In addition to the visual tests, we can use hypothesis test to check if
our data is normally distributed. The Shapiro-Wilk’s normality test is
one of the most widely used test. We can run this test using the
shapiro.test function in R.
shapiro.test(mtcars$hp)##
## Shapiro-Wilk normality test
##
## data: mtcars$hp
## W = 0.93342, p-value = 0.04881The null hypothesis of the Shapiro-Wilk test is that the data is normal.
In our test above, we can get a p-value of .04881 which would be
rejected at the .05 level concluding the data is not normal. However, it
would not be rejected at the .01 level.