
Augmented Dickey-Fuller Test in Python
07.18.2021
Intro
In time series analysis, we often want to check if a time series is stationary. This is because when modeling, most of our techniques rely on stationary time series. One way to check for a stationary seires is to use the Augmented Dicky-Fillter Test. In this article, we will learn how to conduct the Augmented Dickey-Fuller Test in Python.
The Augmented Dickey-Fuller Test is a hypothesis test. The null-hypothesis is that the time series is non-stationary, and the alternative is that the series is stationary. Thus, we need to find a p-value low enough to reject our null hypothesis, thus suggesting the series is stationary.
How to Conduct the Augmented Dickey-Fuller Test in R
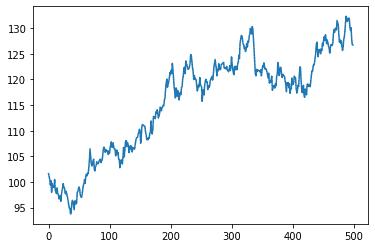
Let's first create a random walk of data. We can use numpy to create a rank walk. By definition, the random walk is non-stationary.
import numpy as np
import matplotlib.pyplot as plt


np.random.seed(1)

# 500 samples with mean 0 and std 1
steps = np.random.normal(loc = 0, scale = 1, size=500)

# Start with 100 and generate the steps based on the sum
random_walk = 100 + np.cumsum(steps)

# Plot
plt.plot(random_walk)
plt.show()
Now, we an perform the dickey-fuller test. Do do this, we will use the adfuller method from the statsmodels package.
from statsmodels.tsa.stattools import adfuller

adfuller(random_walk)
(-1.2724258901607888,
0.641691215368452,
0,
499,
{'1%': -3.4435228622952065,
'5%': -2.867349510566146,
'10%': -2.569864247011056},
1348.369472855618)The format isn't the best, but the p-value here is the second value, 0.6416912153684522.
We can see that we received a p-value of .64169, thus we fail to reject the null hypothesis and conclude that our time series is non-stationary.
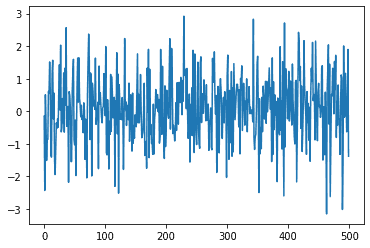
Next. let's generate a white noise time series, which is by definition stationary.
import numpy as np

white_noise = np.random.normal(loc  =0, scale = 1, size = 500)

plt.plot(white_noise)
[<matplotlib.lines.Line2D at 0x271fffd2910>]
Again, we can use the adfuller method to check for a stationary time series.
from statsmodels.tsa.stattools import adfuller

adfuller(noise)
(-14.853158359917881,
1.7645503606741108e-27,
1,
498,
{'1%': -3.4435494520411605,
'5%': -2.8673612117611267,
'10%': -2.5698704830567247},
1380.9350105713183)Here we receive a p-value of 1.7645503606741108e-27 which is much smaller than 0.01, thus we can reject the null hypothesis as the .05 level. This suggest that our time series is stationary. We know this is true since we generated white noise.