How to Create a ggplot QQ plot in R
05.19.2021
Intro
A qqplot or quantile-quantile plot helps you determine if the normality assumption of data holds. In this article, we will learn how to plot a qqplot with ggplot2.
Short on Time
If you are short on time, here is the code. Read on for more details.
library(tidyverse)## -- Attaching packages --------------------------------------- tidyverse 1.3.1 --
## v ggplot2 3.3.3 v purrr 0.3.4
## v tibble 3.1.0 v dplyr 1.0.5
## v tidyr 1.1.3 v stringr 1.4.0
## v readr 1.4.0 v forcats 0.5.1
## -- Conflicts ------------------------------------------ tidyverse_conflicts() --
## x dplyr::filter() masks stats::filter()
## x dplyr::lag() masks stats::lag()data(starwars, package = 'dplyr')
ggplot(starwars, aes(sample = height, colour = factor(eye_color))) +
stat_qq() +
stat_qq_line()

Loading the Data
If you are familiar with my tutorial, I like to use the starwars data set, so we wil load that.
library(tidyverse)
data(starwars, package = 'dplyr')
Creating the Basic Plot
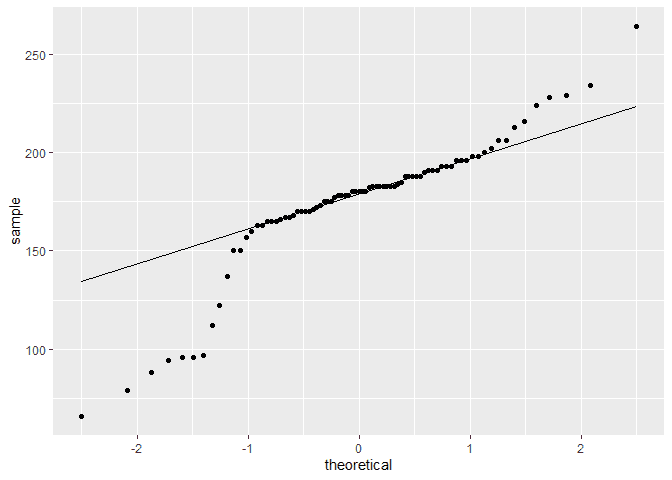
To create the basic plot, we can use the stat_qq function to calculate
the quantiles and the stat_qq_line to calculate the line. We attach
both of these calls to our normal qqplot function call. However, we
pass the value we want to the sample param in our aesthetic. Here, we
are plotting height.
ggplot(starwars, aes(sample = height)) +
  stat_qq() +
  stat_qq_line()
## Warning: Removed 6 rows containing non-finite values (stat_qq).
## Warning: Removed 6 rows containing non-finite values (stat_qq_line).
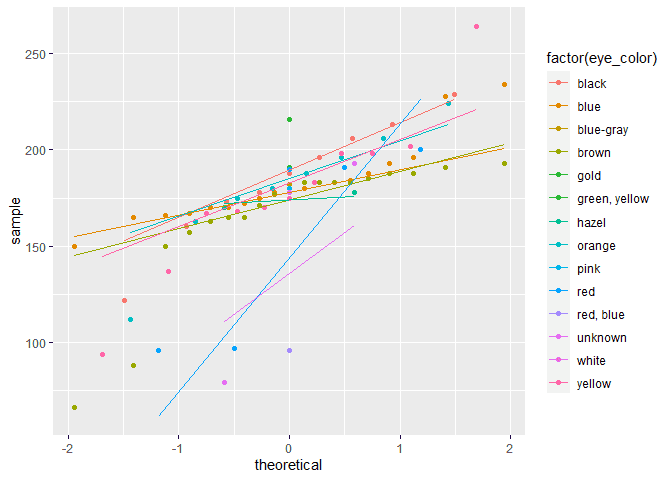
Creating a QQ plot by factor
We can also split our qqplots across a factor. If we add a factor variable of eye color to the aesthetic, we can accomplish the plot below.
ggplot(starwars, aes(sample = height, colour = factor(eye_color))) +
  stat_qq() +
  stat_qq_line()
## Warning: Removed 6 rows containing non-finite values (stat_qq).
## Warning: Removed 6 rows containing non-finite values (stat_qq_line).
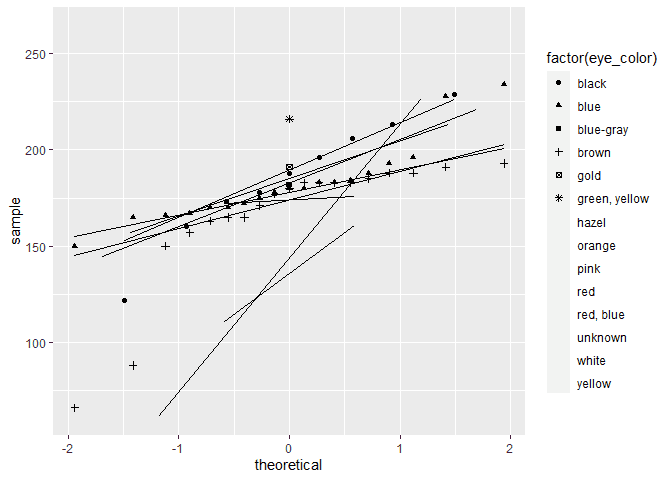
We can also do a similar separate by shape instead of color.
ggplot(starwars, aes(sample = height, shape = factor(eye_color))) +
  stat_qq() +
  stat_qq_line()
## Warning: Removed 6 rows containing non-finite values (stat_qq).
## Warning: Removed 6 rows containing non-finite values (stat_qq_line).
## Warning: The shape palette can deal with a maximum of 6 discrete values because
## more than 6 becomes difficult to discriminate; you have 14. Consider
## specifying shapes manually if you must have them.
## Warning: Removed 31 rows containing missing values (geom_point).
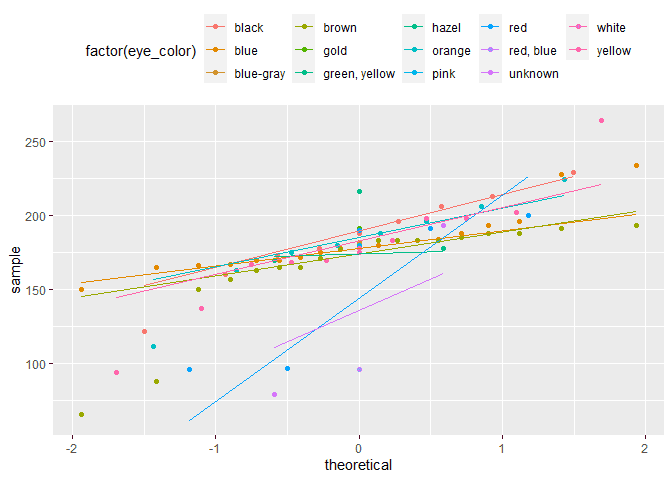
Changing the Legend
We can use the theme function with the legend.position paramter to
adjust the legend. Here are a few example of changing the legen position
and removing it.
ggplot(starwars, aes(sample = height, colour = factor(eye_color))) +
  stat_qq() +
  stat_qq_line() +
  theme(legend.position="top")
## Warning: Removed 6 rows containing non-finite values (stat_qq).
## Warning: Removed 6 rows containing non-finite values (stat_qq_line).
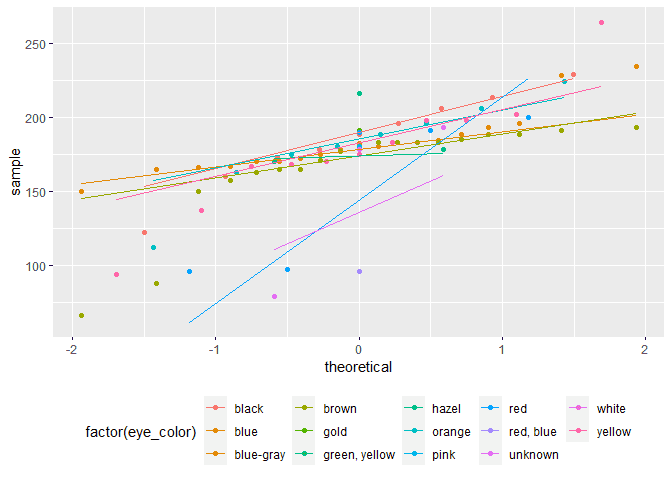
ggplot(starwars, aes(sample = height, colour = factor(eye_color))) +
  stat_qq() +
  stat_qq_line() +
  theme(legend.position="bottom")
## Warning: Removed 6 rows containing non-finite values (stat_qq).
## Warning: Removed 6 rows containing non-finite values (stat_qq_line).
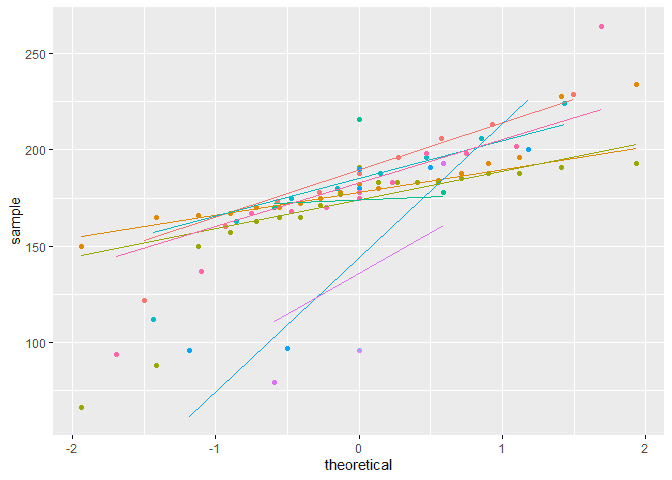
ggplot(starwars, aes(sample = height, colour = factor(eye_color))) +
  stat_qq() +
  stat_qq_line() +
  theme(legend.position="none")
## Warning: Removed 6 rows containing non-finite values (stat_qq).
## Warning: Removed 6 rows containing non-finite values (stat_qq_line).
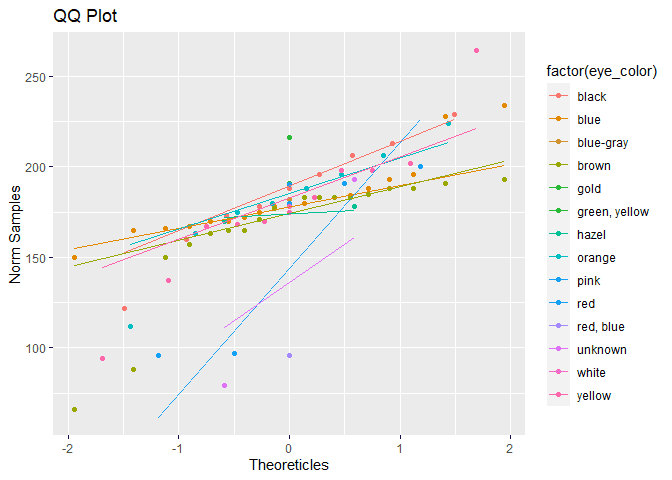
Customizing the Labels
To customize the titles on the plot, we can use the labs function.
This allows use to edit title, x label and y label.
ggplot(starwars, aes(sample = height, colour = factor(eye_color))) +
  stat_qq() +
  stat_qq_line() +
  labs(
    title = "QQ Plot",
    x = "Theoreticles",
    y = "Norm Samples"
  )
## Warning: Removed 6 rows containing non-finite values (stat_qq).
## Warning: Removed 6 rows containing non-finite values (stat_qq_line).